

| LTPDA Toolbox™ | contents | |
The ao/detrend method offers the possibility to remove polynomial trends from a data series.
The method can be configured with the following parameters:
| Key | Description |
|---|---|
|
N (or 'ORDER') |
The order of the polynomial to fit and remove. For orders below 10, a very fast C-code algorithm is used. For higher orders, the MATLAB functions polyfit and polyval are used to construct the polynomial which is then subtracted from the data. |
In this example we will construct a time-series consisting of noise plus a known quadratic trend. We will then remove that trend using ao/detrend and compare the detrended time-series with the original noise.
First let's create the time-series series consisting of the noise plus trend.
    % Construct noise data stream
    fs = 10;
    nsecs = 10;
    pl = plist('name', 'None', 'tsfcn', '5+randn(size(t))', 'fs', fs, 'nsecs', nsecs, 'yunits', 'V');
    x  = ao(pl);
    % Construct a quadratic data series
    pl_trend = plist('tsfcn', 't.^2', 'fs', fs, 'nsecs', nsecs);
    trend = ao(pl_trend);
    % Add them together
    fcn_trend = x + trend;
| The offset of 5 is added to the noise to ensure the data series doesn't come close to zero; we want to divide by it later in the example. |
Next we will detrend the data and compare the result to the noise data x we made above.
    pl_detr = plist('N', 2);
    detr    = detrend(fcn_trend, pl_detr);
    iplot(x, fcn_trend, detr, plist('LineStyles', {'', '', '--'}));
| In the plist we specified 'LineStyles' as empty strings. These just serve as place holders and can be interpreted as "just to the default". If you want a data-series plotted with no line, then specify 'none', for example, {'none', '-', '--'}. |
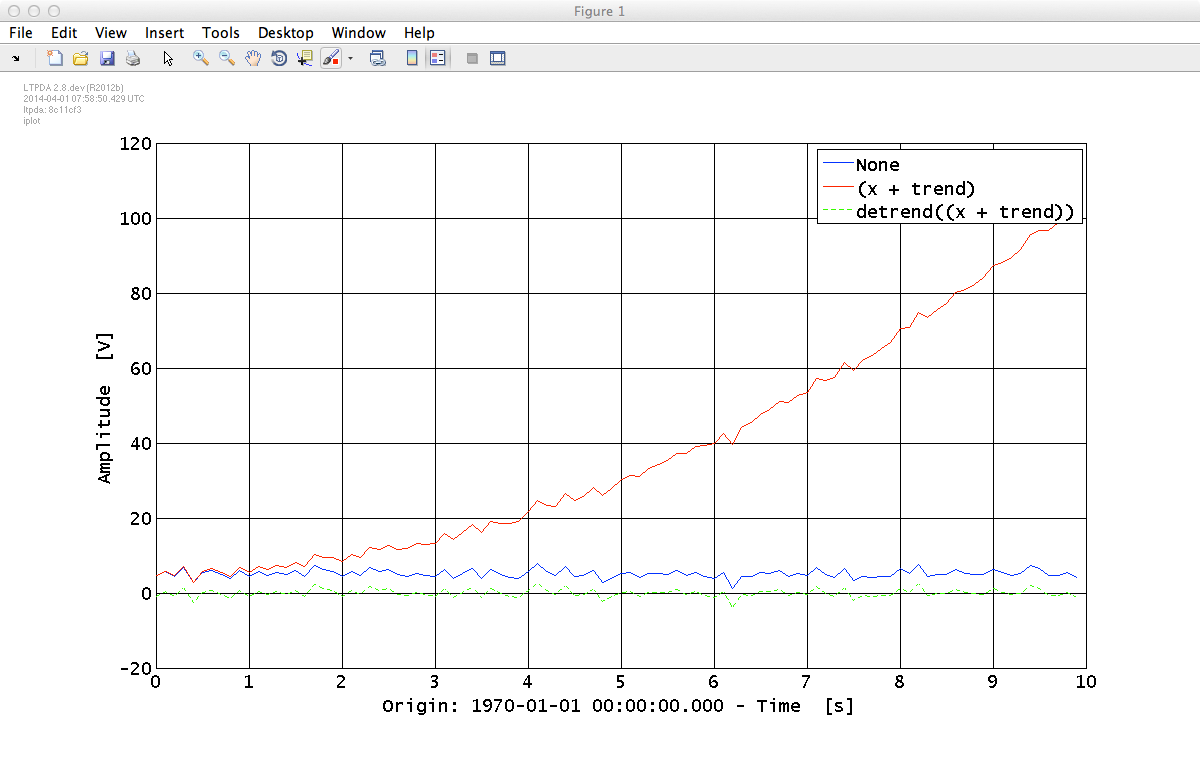
From this plot, it is not very easy to see how well our detrending worked. Let's form the fractional difference of the original x data and the detrended data and plot that instead.
    detr5 = detr + 5;
    differ  = 100 .* (x - detr5) ./ x;
    iplot(differ);
The result is shown below. We added the value 5 to the detrended time-series just to ensure that we don't divide by any values close to zero.
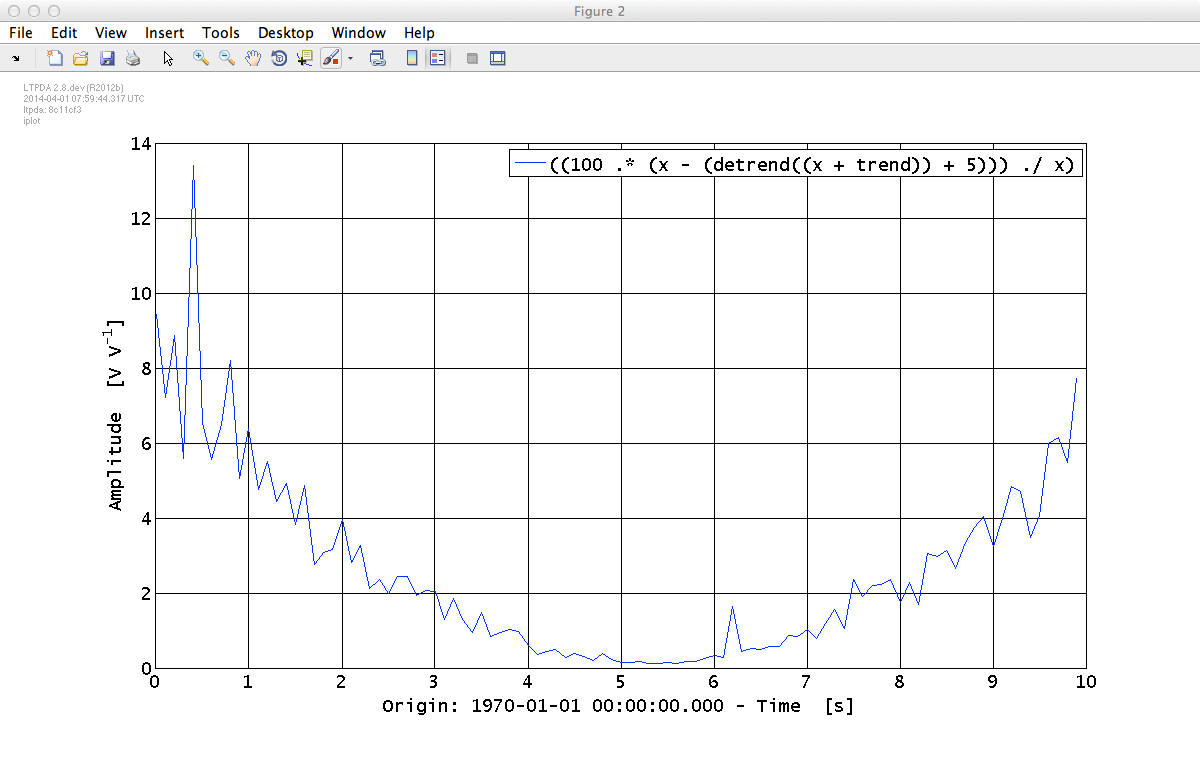
Try increasing the length of the data series to say, 1000 or 10000 seconds, to see how the detrending improves.
The value of the coefficient describing the subracted trend are included in the field procinfo of the ao objects. The procinfo is actually a plist object, so we can search for parameters, in this case the key is 'coeffs':
    c = find(detr.procinfo, 'coeffs');

    % Remember also, that you will loose the 'coeffs' if you make any operation on the "detr"
| |
Interpolation of a time-series AO | Whitening noise | |
©LTP Team