Additional 3rd-party software
Some features of the LTPDA Toolbox require additional 3rd-party software to be installed. These are listed below.
Graphviz
In order to use the commands listed below, the Graphviz package must be installed.
| Method |
Description |
|
history/dotview
|
Convert a history object to a tree-diagram using the DOT interpreter.
|
|
ssm/dotview
|
Convert the statespace model object to a block-diagram using the DOT interpreter.
|
|
report
|
Generates a HTML report about the input objects which includes a DOT block-diagram of the history.
|
The following installation guidelines can be used for different platforms
Installation Guide for Windows
Installation Guide for Mac OS X
Installation Guide for Linux
Windows
Download the relevant package from Downloads section of www.graphviz.org.
Install the package by following the relevant instructions.
Set the two relevant preferences with your LTPDA Preferences Panel
- For this start the LTPDApres
- Select on your LTPDA Preferences Panel the category "External Programs"
- Set the path to the 'dot.exe' binary in the editable text field "DOT binary". If you perform the default installation, this should be something like:
'c:\Program Files\Graphviz2.28\bin\dot.exe';
- Define in the editable text field "DOT format" the graphics format to output. See formats for available formats. To view the final graphics file you must have a suitable viewer for that graphics format installed on the system. For example, to output as PDF, choose 'pdf'.
Mac OS X
- Choose from:
- From graphviz:
- Download the relevant package from Downloads section of www.graphviz.org.
- Install the package by following the relevant instructions.
- From Fink:
- If you use the fink package manager, in a terminal: > fink install graphviz
- Set the two relevant preferences with your LTPDA Preferences Panel.
- Start the LTPDA Preferences Panel. For this follow the step 3.1 or 3.2 of the installation on Windows.
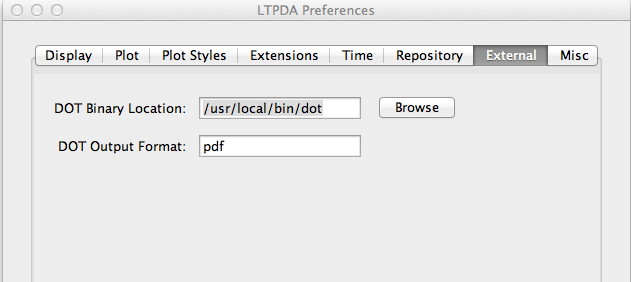
- Set the path to the 'dot' binary in the editable text field "DOT binary".
- If you performed the default installation from fink, this should be something like: '/sw/bin/dot'
- If you performed the default installation from the web page, this should be something like: '/usr/local/bin/dot'
- Define in the editable text field "DOT format" the graphics format to output. See formats for available formats. To view the final graphics file you must have a suitable viewer for that graphics format installed on the system. For example, to output as PDF, choose 'pdf'.
Linux
- Choose from:
- From graphviz:
- Download the relevant package from Downloads section of www.graphviz.org.
- Install the package by following the relevant instructions.
- From terminal (Ubuntu):
- Please type in a terminal: >sudo apt-get install graphviz
- From graphical package manager like YaSt, Synaptic, Adept, ...
- Start your graphical package manager
- Search for the >graphviz package
- Select the package and all depending packes and install these packages.
- Set the two relevant preferences with your LTPDA Preferences Panel.
- Start the LTPDA Preferences Panel. For this follow the step 3.1 or 3.2 of the installation on Windows.
- Set the path to the 'dot' binary in the editable text field "DOT binary". If you perform the default installation from the terminal, this should be something like:
'/usr/bin/dot';
even 'dot' without the path should work
- Define in the editable text field "DOT format" the graphics format to output. See formats for available formats. To view the final graphics file you must have a suitable viewer for that graphics format installed on the system. For example, to output as PDF, choose 'pdf'.
- Define a programm in MATLAB which opens the file.
- The default programm to open a pdf file is the Acrobat Reader
- Define another program under File -> Preferences -> Help -> PDF Reader
 |
Setting-up MATLAB |
|
Trouble-shooting |
 |
©LTP Team